


Our new quarterly analysis highlights the charts and data that matter to global equity investors, by Schroders
Despite recording the worst drop in economic activity since the Great Depression, 2020 turned out to be a very positive year for financial markets. So what’s been driving stock prices? Are they currently expensive or cheap? And which regions and sectors are poised to do well next?
These are some of the questions we aim to regularly answer in our new quarterly publication – the Schroders Equity Lens, a compilation of key trends in global equities illustrated through thought-provoking charts. Click here to download your copy.
Below is a summary of the analysis included in our inaugural edition.
1. US equity performance was driven by Big Tech
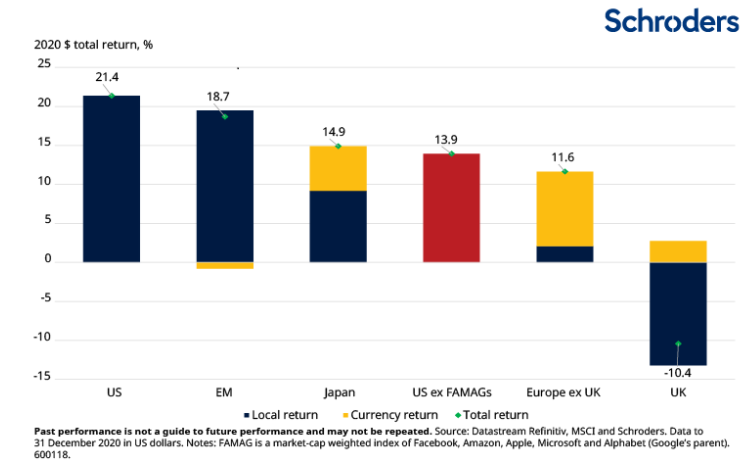
The MSCI All-Country World $ Index returned 16.8% in 2020, led by the US market, which was up 21.4%. US outperformance was heavily attributable to the increasing index concentration and rally in the Big Tech stocks – Facebook , Amazon , Microsoft , Apple and Alphabet ( Alphabet ). We calculated that, without their contribution, US equities would have returned only 13.9% in 2020, behind EM equities (+18.7%) and Japanese equities (+14.9%). This is illustrated in the first chart below.
2. EM performance driven by a narrow group of countries
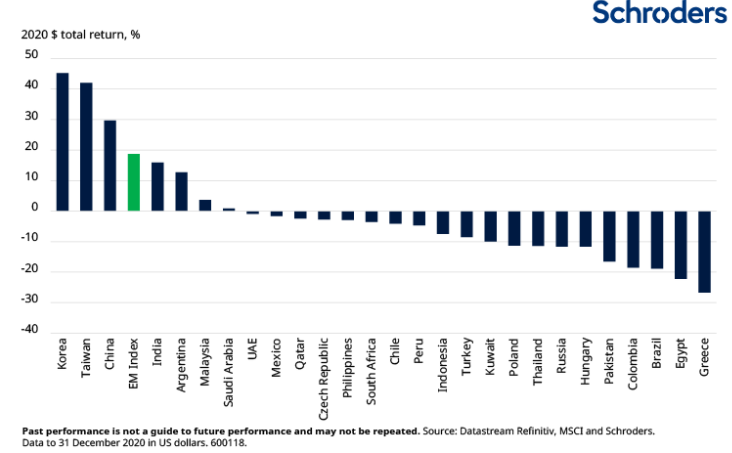
Concentration is not unique to the US but also extends to the EM universe. Only 7 out of the 27 countries in the MSCI EM Index posted positive returns in 2020, highlighting the narrowness of the EM rally. Stand-out markets included South Korea (+42.7%), Taiwan (+42.0%) and China (+29.7%). Their effective response to contain Covid-19 helped their economies to return to a degree of normality comparatively better than the rest of the world, sending their stock prices higher in the process.
3. The most beaten-up sectors rebounded sharply from their pandemic lows
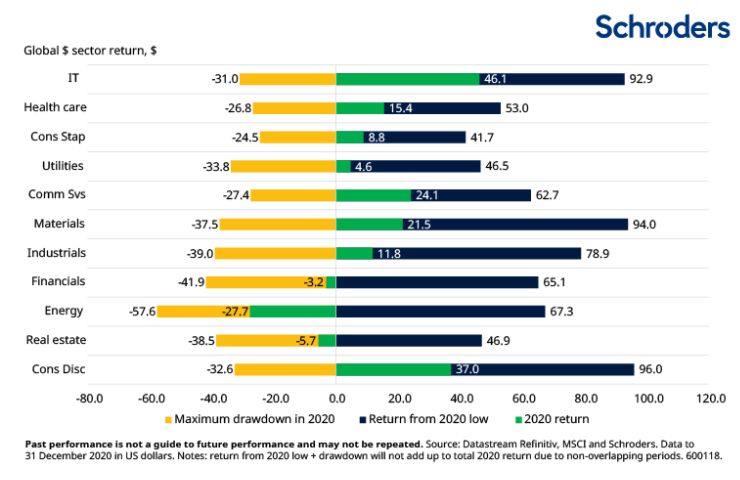
Many of the sectors that suffered deep drawdowns earlier in the year made a substantial comeback. The extraordinary monetary stimulus pumped by central banks around the world combined with market optimism for a Covid-19 vaccine underpinned much of the rebound.
For example, the peak-to-trough loss for global material stocks (e.g. chemical companies and steel producers) was 37.5%. However, they posted a total return of 94.0% from their 2020 low. Similarly, global energy stocks experienced a drawdown of 57.6%, but rebounded by 67.3% from their market low.
4. Analyst sentiment has become increasingly upbeat
Has the global economy turned a corner? Analysts seem to think so. Since last summer, they have turned increasingly bullish about the corporate earnings outlook for the coming year. We can infer this from the ratio of positive to negative forward 12-month earnings revisions, as shown in the chart below. A ratio above 1 signals that earnings upgrades exceed downgrades.
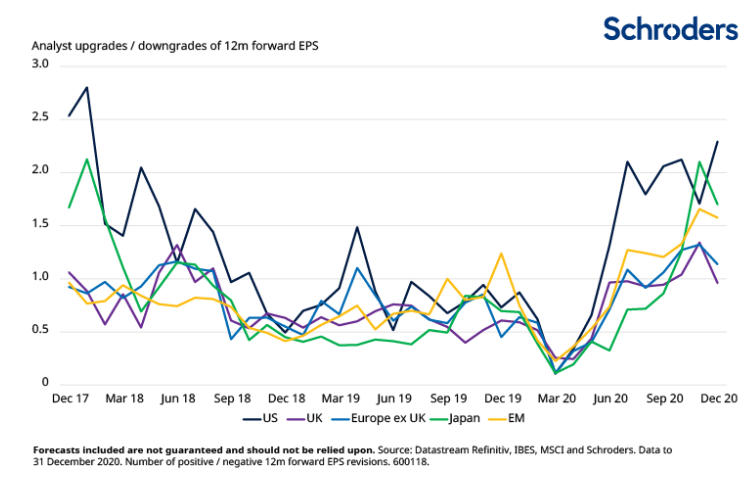
For example, for the month of December, the US led the pack, with more than twice as many upgrades as downgrades. Positive sentiment is also reflected in Japanese and EM equities, which recorded 50-70% more upgrades than downgrades. Meanwhile, European equities trailed significantly behind with only 13% more upgrades than downgrades while analysts covering the UK were relatively neutral.