


By Peter Garnry, Head of Equity Strategy, Saxo Bank
The cryptocurrency market is feeling the shockwaves from "stable coins" being tested to its very core with Tether printing figures just above 0.96 this morning suggesting signs of panic and massive selling pressures. There is a huge overlap of people that invest in both Tesla, Ark Invest funds, and cryptocurrencies and that makes this risk cluster dangerous because it becomes a forceful negative feedback loop on the downside. Unfortunately for investors the VIX forward curve is not suggesting that capitulation has been reached and thus more pain is likely ahead.
 Peter Garnry |
Tesla shares were down 8.3% yesterday and are indicated lower in pre-market trading with the $700 level a major support level to watch. Ark Invest is haemorrhaging across all its funds as the entire technology sector is under siege with the most attention being on its biggest fund the Ark Innovation ETF. This fund is now flirting with levels not seen since the lows during the early pandemic taking the fund back four years in terms of performance. Tesla is the key to this risk cluster as it is the most liquid instrument in this risk cluster and thus the one that is sold off the latest. The key dominator across these assets is young people and primarily men which amplifies the moves. Be careful.
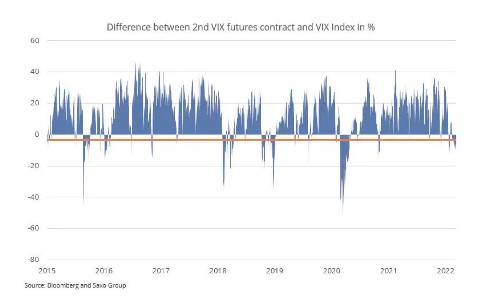
VIX forward curve suggests more pain ahead
While it is painful in equities this year and the only safe-havens have been commodities and cash, markets have unfortunately not reached its capitulation level. The degree of inversion in the VIX forward curve is often a good sign that a short-term bottom has been reached. The chart below shows the difference between the 2nd VIX futures contract and the VIX Index (spot). More negative values mean more inversion or that spot is moving above forward volatility. As the chart also indicates, deeply negative values are associated with market meltdowns and severe risk-off. We are not there yet, so another 10% decline in equities is not unimaginable.
One the big themes that will continue to drive inflation and market dynamics is the ongoing energy crisis which has been amplified by the war in Ukraine and the coming ban of Russian oil in the EU. But the biggest problem is that of available crude oil which is driving up refinery margins, see our equity note A new golden age of oil refiners, which is indicating an oil market that is wildly out of balance.
Moreover investments are not going up meaningfully despite higher prices. ESG mandates and the 5-year forward on Brent crude at $70/brl are holding back investments so the front-end of the oil market will continue to get more expensive at the cost of economic growth and household purchasing power for other goods and services. IEA’s recent statement suggests that things are extraordinary and that the energy crisis will continue to add to inflation.