


By Peter Garnry, Head of Equity Strategy at Saxo
 Peter Garnry |
European equities outperformed US equities from December 1969 to October 1990 in USD terms by 2.7% annualised. The end of that period marked the transition period into the age of digitalization.
During the 1990s, the US economy began to accelerate faster than the European economy and the Internet boom in Silicon Valley accelerated into the first big bubble in US equities since the ‘Nifty-Fifty’ days in the 1960s. From October 1990 to June 1999 the US equity market outperformed European equities by 6.4% annualised putting US equities on the map in a way not seen in decades.
During the subsequent period until November 2007, European equities outperformed again driven by the credit boom, post euro adoption leading to inflows of capital, Chinese driven commodity supercycle, and the first sizeable export boom to the roaring tiger economies in Asia. In November 2007, the US equity market reached its all-time relative low against European equities since December 1969.
From November 2007 to October 2022 was a one-way highway for US equities as the digitalisation accelerated at an ever increasing speed with technology giants such as Microsoft , Apple , Amazon , Nvidia , Alphabet (parent company of Alphabet ), Meta (parent company of Meta ), Salesforce, and Adobe conquering the world of the digital age. US equities outperformed European equities by a staggering 7.5% annualised outpacing even the run-up to the Dot-Com Bubble. The technology race was effectively lost by Europe many years before this period, but the ultimate crystallisation for investors was during this period. Nobody wanted to touch Europe. It was the old sick man of the global economy according to investors. Silicon Valley was where the returns were to be made.
European equities have outperformed US equities by 16.7% since October 2022 with the outperformance this year being 3.9% in USD terms. This significant comeback for European equities have made investors more interested in European equities. If we are right about the renaissance of the physical world as outlined in our Q1 Outlook, then European equities could continue to outperform.
Understanding the European equities and the STOXX 600 Index
The European equity market is the second largest combined equity market in the world with the STOXX 600 being the leading benchmark index consisting of the 600 most liquid equities in Europe. The STOXX 600 Index had market capitalisation of €12.7trn on 31 January 2023 compared to the S&P 500 total market capitalisation of around €32.8trn, so almost three times larger.
The four largest country weights in the STOXX 600 Index are Great Britain, France, Switzerland, and Germany, and the largest sector being the health care sector. This is also evident in the top 10 components list where four health care companies are on the list ( Novo Nordisk , Roche , AstraZeneca, and Novartis ). The three biggest individual index weights are Nestle , ASML , and LMVH.
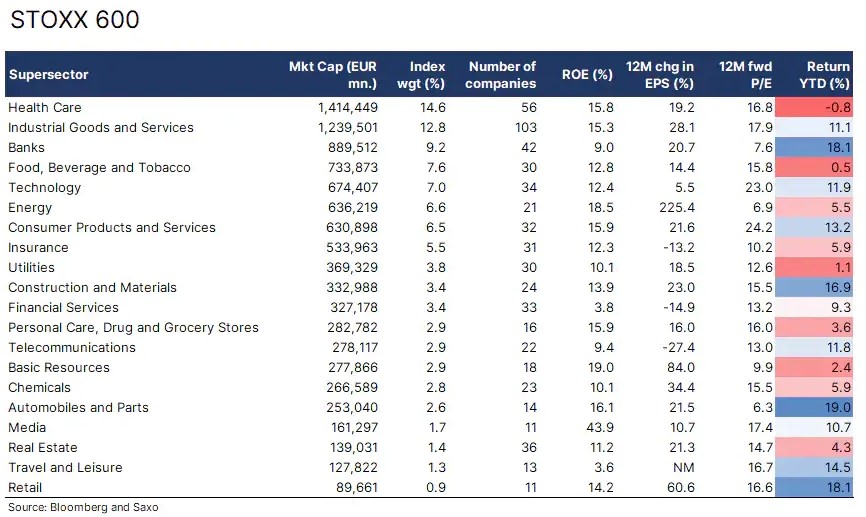
Europe’s supersectors
The STOXX 600 Index divides its constituents into 20 supersectors defined by the Industry Classification Benchmark (ICB). In terms of number of companies the biggest supersector is the Industrial Goods and Services consisting of 103 companies with the three largest being Siemens , Schneider Electric , and Airbus.
The most profitable supersector measured by the return on equity (ROE) is Media with a ROE of 43.9%. The three largest companies in the media supersector are RELX , Wolters Kluwer , and Publicis Groupe Groupe. In terms of earnings growth over the past year the winner has been energy with earnings per share up 225%. Europe’s three largest energy companies are by far Royal Dutch Shell , BP , and TotalEnergies.
The most expensive supersector measured by the 12-month forward P/E ratio is Consumer Products and Services and the largest companies in this supersector are LVMH , L’Oreal, and Richemont . A significant contributor to Europe’s outperformance since October 2022 has been luxury stocks which are part of this supersector as investors have looked for good bets on the Chinese reopening post its zero-Covid policy. Interested readers can read our equity note from 17 February on the global luxury industry which is dominated by European companies.
The most cheapest supersector measured by the 12-month forward P/E ratio is Automobiles and Parts and the largest companies in this supersector are Mercedes-Benz, Stellantis, and BMW .
A more diversified and cheaper equity market
Another interesting observation on European equities is the huge difference in GICS sector weights between the STOXX 600 and S&P 500. The biggest difference is in Information Technology with a 19%-points difference. US equities also have a higher exposure to Communication Services which includes media related companies such as Meta. European equities have a higher exposure to Financials, Industrials, Consumer Staples , and Materials (mining and chemical) which are all tangible-driven sectors. If we are right about reshoring, the geopolitical trajectory of the world splitting into two value systems, the green transformation and the tight supplies of key metals such as copper, the need for massive infrastructure spending then European equities should in theory outperform US equities.
What we also observe is that European equity markets are more diversified and using the Herfindahl-Hirschman approach of comparing sum of squared weights we can conclude that US equities are 19% more concentrated on sector level than European equities. Being overweight US equities is essentially a significant active bet on technology companies to continue outperforming.
Another positive factor for European equities in 2023 is that forward valuations are much more intriguing with STOXX 600 trading at 13.2x on 12-month forward EPS compared to 17.8x for the S&P 500. In other words, US equities are valued at a 35% premium to European equities. Which is still in the highest percentiles of the US valuation premium range since 2008 and a convergence of equity valuations back to the historical average should provide tailwind for European equities.
A key driver to close the valuation premium gap is to close the operating margin gap between US and European companies which has been significant since 2009, but over the past year with the comeback to tangible-driven industries Europe has closed a big part of that gap.